Product Support Dashboard
What Is the Product Support Dashboard?
A ticket dashboard collects all client tickets and provides a centralized place for support teams to view and manage the issues and requests. The dashboard provides a quick, visual overview of ticket status, ticket volume and overall team performance.
What is the data source?
What does each chart mean?
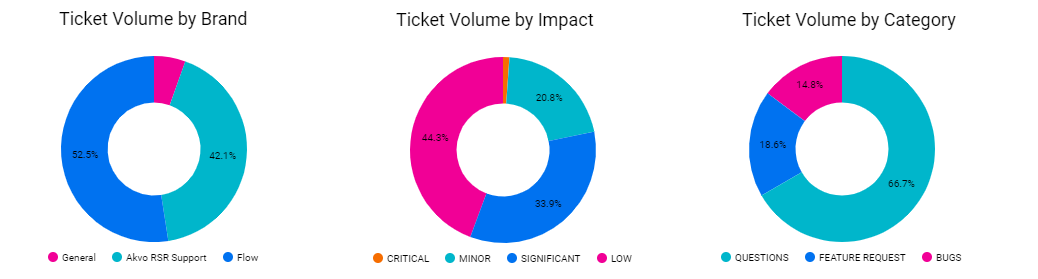
Volume Reports: The Volume report shows you a summary and detailed breakdown of customer support requests. It gives you an idea of how "busy" things are in the world of support. There are 3 volume reports grouped by 1) The product/brand 2) The impact/severity of the issue 3) The category of the ticket
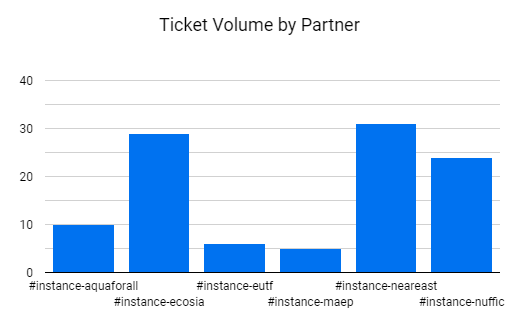
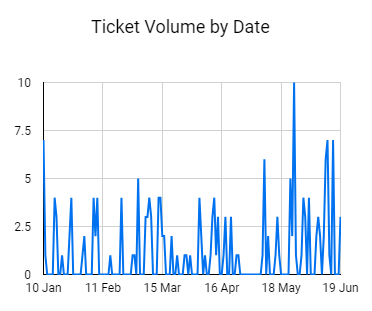
There is an additional volume report that shows which partners have raised the most number of tickets and a summary of the same by date.
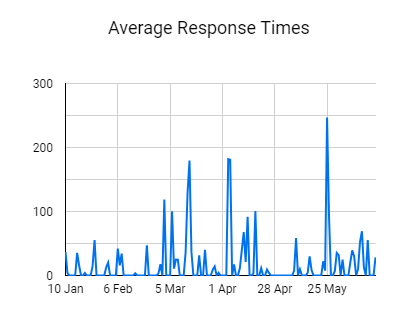
Average Response Time: The Average Response Time report tells how fast your team is getting back to customers. It's a metric on quality of support and the reports show you when you're doing well and when there are deficiencies in speed.